
Tracking COVID-19
Tracking COVID-19
Paul Bleicher ’83M (MS), ’83M (MD/PhD) digs into data to help drive insights about the pandemic
A few weeks ago on a Friday morning, Paul Bleicher ’83M (MS), ’83M (MD/PhD) sat down at his desk and started looking for information on the number of COVID-19 cases nationally, interested in knowing what the numbers were by state and by county within a state. He was particularly curious about the Boston area, where he and his wife Julia Greenstein ’81M (MS), ’81M (PhD) live.
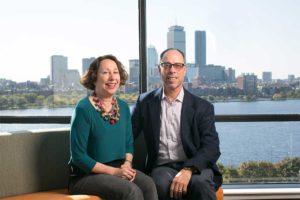
Julia Greenstein and Paul Bleicher
Photo: Katherine Taylor
But, Bleicher was frustrated. He couldn’t find much. So, he started searching for available data that he could use to develop a data visualization dashboard to answer his questions, and possibly to share with others.
Bleicher is no stranger to data, medicine, and health care. He holds a medical degree as well as a PhD in microbiology and immunology from the University of Rochester’s School of Medicine and Dentistry.
Bleicher’s career has been centered on healthcare and clinical trial data, having been a founder of two very successful healthcare data companies, and he is a well-known national expert in real world data. Although recently retired, Bleicher had spent the last six and a half years as CEO of OptumLabs, a healthcare research and innovation collaborative that was started by Optum, a part of UnitedHealth Group.
“Throughout my career, I’ve focused on building companies and tools that make data accessible, which is necessary to address challenges and find solutions in the health care industry,” he says. “This background, combined with my training in science and medicine, is driving a lot of the questions I have now, during the pandemic.”
That Friday search led Bleicher to the New York Times and its daily compilation of COVID-19 data, which is available to the public. With that data, along with US Census information, Bleicher started programming. Within hours, he had created a dashboard to view and compare the number of COVID-19 cases and related information by state. By Saturday, he had county-by-county data mapped out.
Bleicher, active on Twitter (@pbleic), started tweeting about what he was doing. A friend and colleague, Atul Butte (@atulbutte), retweeted Bleicher’s post about his weekend project. (Butte is the director of the Bakar Computational Health Sciences Institute at the University of California San Francisco (UCSF) and chief data scientist at UC Health.) Butte’s 24,700 followers responded. Soon, Bleicher’s post and his statistically-fed data visualization picked up 100,000 views.
On that Twitter-filled Saturday, Bleicher and Butte started talking. Butte suggested that Bleicher and a few of his lab’s postdoctoral students—many of whom spend most of their time with clinical patients—work together to a build an even more robust data visualization tool. The idea was to create something the public could use to gain insights that could provide them with useful information during this health crisis.
That’s what they did, and that’s how www.covidcounties.org was born. The site tracks a variety of information including the number of COVID-19 cases, deaths, occupied beds, and more.
“The site has been live for a few weeks now, and the Butte lab team is constantly adding features to it,” says Bleicher. “The team working on this is incredibly dedicated—when they aren’t with patients, they choose to work on this because they know it offers valuable information to the public.”
Bleicher underscores that the site is useful to the general public because it provides an easily searchable snapshot of what’s happening near them and around them. He adds that it is a snapshot based on data and is not a predictive model.
“The timing of all of this is interesting,” Bleicher says. “I retired in mid-March with ideas in my head of golfing, getting more involved in photography, and doing some consulting a few days a week.”
With the onset of the pandemic and living within these current confined conditions, Bleicher’s immediate focus has shifted. He is now involved with some prominent, national efforts involving COVID-19 data, and is working with local Boston hospitals on making clinical trials more accessible for patients.
“For me, facts frame understanding,” he adds. “Using data and breaking it down in the right way can help people gain knowledge along with an objective perspective, which can be very helpful to have right now.”
We all can do something to help. Consider donating supplies or food, giving blood (URMC is facing a critical shortage), making a gift to our URMC COVID-19 emergency fund, and supporting our student emergency fund.
— Kristine Thompson, April 2020