THESIS in Brain and Cognitive Science
An experience-based sampling approach to examining prior experience in adaptive speech perception
Fall 2024, Volume 23, Issue 1
Seth H. Cutler ’24, Xin Xie, Yuting Gu, Bella Eclevia, Chigusa Kurumada*
https://doi.org/10.47761/XOSM6218
1. Introduction
Human speech perception is amazingly fast and accurate. We map a continuous speech stream into discrete units of meaning as quickly as 2.5 words/second (Griffiths et al., 1990). What’s more, these mappings are probabilistic and change depending on the speaker and their accent. For example, a /z/ sound (e.g., zip) produced by a nonnative speaker with a Spanish accent often sounds like an /s/ (e.g., sip) to native English listeners (Núñez-Méndez, 2022). We must therefore adapt our speech perception to various speakers and accents. This ability is becoming ever more important considering the increasing linguistic diversity in the United States (Tamasi et al., 2014).
Research over the past 20 years has shown that speech adaptation occurs rapidly and subconsciously. For example, Clarke & Garrett (2004) showed that significant adaptation and learning occurred rapidly when native English speakers heard English spoken in a foreign accent. This effect persists in the face of language related disorders (e.g. dyslexia) (Hazan et al., 2009) and through perceptual and cognitive aging. For example, Gordon-Salant et al., (2010) demonstrated that both younger and older adults can conduct rapid adaptation to non-native speech, despite significant hearing differences. The capacity of the human brain is thus malleable, readily accommodating novel speech patterns and accents.
Our adaptivity to language is trainable and can be enhanced by environmental exposure, in both the short and long term. In addition, long-term experiences or “familiarity” with any language variant facilitate general adaptation (Porretta et al., 2020; Witteman et al., 2013). Xie & Kurumada (2024) have demonstrated that there are recognition benefits stretching across three weeks, when integrating foreign accented English. However, questions remain open about the types and amounts of linguistic experience that impact adaptivity of speech perception.
The current thesis aims to extend this literature by testing the hypothesis that linguistic diversity in everyday language experiences can predict the adaptivity listeners show when they encounter a new nonnative accented talker. For instance, Marisa, who lives in a multicultural city with a large immigrant population, may be adept at accommodating a previously unfamiliar accent. In contrast, Sarah, who lives in an English-dominant environment, might struggle to understand an unfamiliar accent. Although intuitive, this hypothesis has not been tested with empirical data. By investigating this hypothesis, we hope to better understand the way everyday linguistic experiences foster perceptual adaptivity and linguistic comprehension.
The work reported here is couched in a larger research project led by Dr. Chigusa Kurumada (University of Rochester) and Dr. Xin Xie (University of California, Irvine) (Gu, Cutler, Xie & Kurumada, 2023). This research intends to quantify the diversity of linguistic experiences in the U.S. and investigate its links to listeners’ perceptual adaptivity in nonnative speech perception. To do so, our team has been developing a composite measure of Socio-Linguistic Diversity (SOLID). As described below, SOLID will assess listeners’ daily exposure to various accents of English through an application compiling subjective ratings, daily surveys, and census-based statistics on their geographic location of residence.
1.1 SOLID measures
Quantifying one’s linguistic experience can be challenging since our integration of spoken language is pervasive and mostly automatic. This means that conscious recall of specific events (e.g., how many non-native speakers have you spoken to in the past week?) is easily clouded by errors in memory encoding and retrieval. The difficulty is intensified by a significant amount of individual variation; even in a single geographic location or household, linguistic experiences can differ widely from person to person. Previous studies on language acquisition have addressed this by conducting dense (and sometimes “around-the-clock”) recording of speech input to infants (Gilkerson et al., 2017; Richards et al., 2017). However, this approach can be invasive of privacy and social interactions when applied to older children and adults.
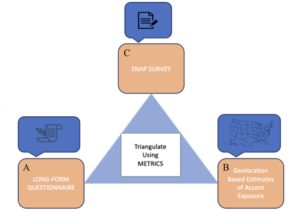 Figure 1. The SOLID measures of accent perception: a three-pronged approach to quantifying prior accent experience. This approach utilizes a long form questionnaire, geolocation-based assessments of accent exposure, and the Experience Sampling Model (ESM) based SNAP survey.
Composed of three parts (Figure 1), SOLID was developed to circumvent these issues and paint a holistic and accurate picture of one’s linguistic experiences. The long form questionnaire in part (A) is a tool that asks participants to reflect on their prior experiences with accents, including their own. Participants are asked to recall experiences up to 40 years in the past (for our oldest participants). Additionally, the long form questionnaire considers many demographic factors, as well as information about a participant’s surroundings. Some of the most crucial and informative questions are oriented toward the individual’s housemates, family, and friends’ language backgrounds (e.g., Where did your parent(s) grow up? Where did your roommate(s) live previously?).
Part (B) of the SOLID measures is a geolocation-based assessment using the American Community Survey data (the United States Census Bureau, Table# B16001). In contrast to the participant’s subjective assessments in A, this measure provides an objective estimate of their daily accent exposure. By collecting information about zip code and county of residence, we can identify the number of non-native speakers in close proximity to the participant. This provides a better idea of how likely a participant is to come into contact with someone speaking with a given accent.
Lastly, part (C) of the SOLID measures is the daily mobile survey (the Survey of Nonnative Accent Perception, “SNAP”) which takes a snapshot of one’s daily linguistic experience through frequent and repeated sampling of linguistic experiences. The current implementation of SNAP uses a periodic survey that samples linguistic exposure, delivered via text message three times daily over a week. This approach complements traditional language background questionnaires, which are prone to memory and recall biases. Through the simplicity, immediacy, and frequency of sampling, SNAP will accurately capture an individual’s daily linguistic experience.
The novelty and significance of SOLID lies in the fact that it is a composite measure, addressing weaknesses associated with each of the three individual parts. The long form questionnaire alone presents a recall bias and a propensity for participants to overestimate their amount of exposure throughout such a broad timescale. In a geolocation-based approach, the scarcity of individualized data is traded for a more holistic view on the subject’s environment. The SNAP surveys allow for a closer look at the daily experiences of individuals, confined within a precise scope and time window. By using the three parts as interlocking measures, we can better collect accurate, individualized, and time/location-locked information about socio-linguistic experiences.
1.2 Thesis overview
This study validates that the SNAP survey protocol allows for three dimensional assessments of SOLID. This protocol was delivered via a mobile application three times daily for seven days. The current thesis describes the development of the survey (Section 2), accompanied by a perceptual experiment that evaluates participants’ adaptivity to a nonnative accent (Mandarin accented English, Section 3). The design and the data in this section are from a larger study partially described in Xie et al., (2023). The specifics of the study conducted by the primary author will be discussed (Section 4) before providing a general discussion and future directions (Section 5).
This study observed 20 subjects at two sites: Rochester (NY) and Irvine (CA), representing starkly different demographics and linguistic landscapes. The protocol for assessing adaptive perception of nonnative accent was validated based on the survey responses, after administering the SNAP and the perceptual experiment.The research compiled in this thesis was based on this experiment, although subsequent studies may be conducted to further support the evidence. In this light, the current protocol aims to provide a critical initial step towards clarifying the way daily accent exposure might induce a rapid adaptation to accented speech. If daily experience promotes adaptivity, then subjects with more exposure to a certain accent (e.g., Mandarin-accented English) should better comprehend and adapt to a Mandarin-accented speaker presented in our perceptual experiment. Alternatively, if experience is not a strong predictor, the measures will not explain the variance in the experimental results.
Thus, SNAP and perceptual data will provide insights into the sources of perceptual adaptivity. By proposing and refining the protocol, this thesis will ultimately contribute to a better understanding of how our life-long experiences may interact with the mechanisms of robust and effective human speech perception.
2. Developing the SNAP survey
2.1 Experience sampling model background
In recent years, several social, clinical, and cognitive science studies used the Experience Sampling Model (ESM) to assess everyday behaviors. The ESM typically consists of regular assessments of a behavior or exposure variable, repeated throughout multiple days to paint a picture of recent, natural participant experience. The main advantage of the ESM over alternatives is its immediacy. Respondents do not need to recall and reconstruct past events; instead, they can report on their most recent experiences, providing more accurate and detailed responses. Using an ESM, Goodman et al. (2021) quantified social anxiety “with a clinical sample of adults diagnosed with social anxiety disorder (SAD) and a psychologically healthy comparison group.” They gathered significant amounts of information about the participants’ immediate experience and thoughts regarding socially stressful situations, which are less likely to be recalled later.
More recently, Arndt et al. (2023) utilized ESM to quantify language experience, making it a compelling starting point for validating my research and study design. This study analyzed second language (L2) acquisition. Their reporting was done through a similar application, gauging a participant’s use of a language with regard to both qualitative assessments and frequency. They found that “[M]any studies report no more than moderate correlations between aggregated ESM and retrospective survey data […] which indicates that these methods provide substantially different pictures of an individual’s typical behavior and experiences ” (p. 46). Arndt’s protocol served as the most relevant precursor that helped inform the development of the SNAP survey.
2.2 Protocol
Under the current protocol, the SNAP survey is administered over seven consecutive days. Participants receive surveys in three different time windows: “morning” (9:00am until 1:00pm), “afternoon” (1:00pm until 5:00pm), and “evening” (5:00pm until 9:00pm). During each of these time windows, one survey is sent out at a random time. This makes it difficult for participants to anticipate the exact timing of a notification, resulting in the most naturalistic and unbiased responses. The survey remains active for one hour, after which it expires. No replacement survey is provided. In order to receive full compensation at the culmination of the study, each participant must respond to 19 out of 21 (90%) of the surveys. This threshold is set to encourage responses and to collect an adequate number of datapoints to analyze across all participants.
SNAP Surveys were administered through ExpiWell (https://www.expiwell.com/), an application designed for ESM and ecological momentary assessments. Participants downloaded the ExpiWell app receiving notifications and reminders (Figure 2A). To log in, each participant entered an individualized four-digit ID provided by the research team (Figure 2B). This increased privacy, by eliminating the need for participants to share their name or email address. The app interface (Figure 2C) and usage of pop-up notifications made it both easier and more likely for participants to respond, in comparison to, for example, generic email notifications.
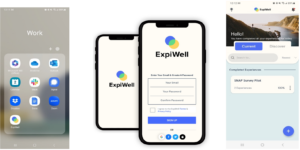 Figure 2. ExpiWell app notifications trigger participant responses as they show up on participant’s phones at randomized times throughout the day. Notifications will show up on participant’s mobile devices when the survey is made available on the app (this will include a notification picture in 1-2 days)
2.3 Survey flow and questions
In each survey, participants answered up to 10 questions intended to assess participants’ daily exposure to different linguistic inputs, including nonnative-accented English. Each question targets a specific component of the participant’s experience, providing researchers with data about the types and amounts of linguistic input, as well as the context for these inputs.
There is a separate branch of the SNAP survey not discussed below, which ensures honest completion of the study. This branch of the SNAP survey stems from the “No” response at Question 3. If a participant answers “No,” they are directed to questions asking about their language experience throughout the whole day. Additionally, there are further questions about the participant’s language environment with reference to their surroundings and social network, (i.e., how many people have you heard speak (in conversation, via social media, listening in a lecture, etc.) since waking up?) There is branching at Question 3, where the ”Yes” and “No” options lead to different sets of questions (Figure 3). Both options resulted in participants answering a similar number of questions overall. If they answer “No”, they receive a series of questions about their general linguistic behavior. However, their answers to these questions are not of interest here. Each of the following questions, and their intended purpose, as described below, with focus on the path where participants answered “Yes” to Q3 (“In the past hour, have you listened to any speech?”).
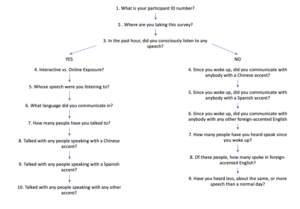 Figure 3. A logic tree of the branching involved in the SNAP survey questions on ExpiWell. The important branching node occurs at Question 3, where participants are directed to a “Yes” branch or a “No” branch.
Question 2: Where are you taking this survey?
This question asks about the context of linguistic interactions. Participants have three options: home, indoor public place, and outdoor public place. This gains information about where and in what kind of environment participants may be encountering a given type of linguistic input. For example, “home” suggests the input is provided by a family member or through media being viewed at home, such as a movie. On the other hand, “indoor public place” and “outdoor public place” suggest that the input is likely associated with different types of social functions (e.g., visiting a hospital or attending a lecture vs. overhearing a conversation on the street or meeting a friend in a park). This is primarily an introductory question that requires a simple, straightforward answer and that remains constant across all the surveys.
Question 3: In the past hour, did you consciously listen to any speech?
This question is the “trigger” for the rest of the survey. If the participant answers “Yes” to this question, they then continue to the next part of the survey, which asks about their most recent language experience. If they answer “No”, they will be directed to 7 different questions.
Question 4: Was your experience with the speech interactive in-person (participating in conversation, in person), interactive online (remote, over the phone, FaceTime), just listening in-person (sitting in a lecture, bystander to conversations), or just listening online (social media, movies, songs)? Choose all that apply.
This question asks about the mode of linguistic interactions participants engaged in. This is based on the assumption that linguistic input might have different effects on participants’ perceptual abilities depending on if it occurs in interaction or in passive exposure.
Question 5: Of the speech that you heard in the last hour, whose speech were you listening to? Choose all that apply. (Family member, friend, somebody that I know and have met before, colleague, stranger).
This question is a checkbox question, indicating that participants can answer with multiple responses. It assesses both the types of talkers they interact with and the diversity of the interactions.
Question 6: Which language did you primarily communicate in/listen to in the past hour?
This question is included primarily for the future extension of the SNAP survey to bilingual and multilingual individuals and communities. As the survey participants were native English speakers, it was expected that the predominant answer would be English, however, it is possible that some of the participants have more exposure to linguistic input in a language other than English.
Question 7: In the past 1 hour, how many people did you talk to or listen to? (Include non-personal interaction such as watching TV, listening to podcasts, attending a lecture).
This question is another quantitative assessment of speaker diversity, related to the existing literature on the effect of social network size on adaptive speech perception. For example, people with a larger social network are found to be better at vowel perception in noise (Lev-Ari, 2018), but worse at speech recognition, presumably due to the crowded memory traces (Lev-Ari, 2018; 2022). In the past, a social network size has been estimated based on subjective estimates (e.g., how many adult individuals do you regularly interact with for at least 5 minutes each week?), but this question provides more precise estimates of the number of interaction partners as well as the contexts of interaction.
Question 8, 9, and 10: In the past 1 hour, did you talk with or listen to anybody in English who has a Chinese/Spanish/other non-native accent? (Include all personal interactions, phone calls, and TV/movie watching experiences).
These questions ask if there is any input from a Chinese accent, Spanish accent, or other non-native accent. In this study, we expected that participants in Irvine would be more likely to answer “yes” overall than participants in Rochester. However, within each location, there is expected to be a substantial individual variance. This will be used to predict the behavioral results of the perceptual experiment.
3. Background on perceptual experiment
The SNAP survey can be combined with a multitude of experiments. This work has used a cross-modal word matching task developed to examine rapid adaptation to accented speech and speech in noise (Clarke & Garrett, 2004; Xie et al., 2018). Because the task is short and relatively straightforward to implement online, it is suitable for the SNAP survey.
In this task, participants are instructed to listen to spoken sentences and provide judgements as to whether the last word of a sentence matches a printed prompt on the screen (Figure 4A). These sentences are meant to be “low predictability”, meaning the preceding context in a sentence is not informative about the identity of the final word (e.g., “Dad pointed at the beaver”). The basic idea is that the accuracy and response times would reflect the listener’s current level of adaptation. The more exposure a participant gets, the more accurately and rapidly one can make the “match” vs. “mismatch” judgments.
 Figure 4 – Trial layout for all trials in the perceptual experiment. B) Outline of a participant’s full experience when participating in the perceptual experiment
In Xie et al., (2018), the main experimental portion of this task consists of three exposure blocks and one test block (Figure 4B). Using a between-subject design, participants were randomly assigned to one of the three exposure conditions: a) native, clear speech (Control); b) native speech embedded in speech shaped white noise (Noise); and c) Mandarin-accented speech (Accent). After 6 trials of practice items produced by a native talker, participants received 18 exposure items and 6 test items. The design shown in Figure 5 is from Experiment 2 of Xie et al. (2018), in which the test talker is a novel talker of Mandarin-accented English to equate the talker-switch costs for all conditions. Finally, participants receive 6 more baseline trials, information from which is used to normalize baseline differences in response times.
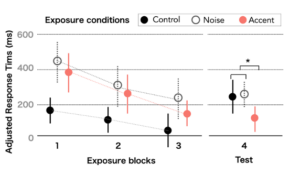 Figure 5 – Depicting the results for participants in Xie et al., (2018)’s cross modal priming paradigm, adapted for the current study. Each experimental group is shown in a different color and undergoes three exposure blocks along with one test block.
The original study found a significant difference between the Accent vs. the other conditions in both error rates and response times (Figure 5). Overall, the response times decrease for all groups as they proceed through the exposure blocks as they adapt to the task and stimuli. In the test block, however, only those exposed to the same nonnative accent in the exposure block were able to respond much more quickly than other groups. This has been taken to suggest that the mere 18 items of exposure led to adaptation to the Mandarin-accented speech. These findings also suggest that exposure effects generalize across speakers with the same accent (Xie et al. 2018). The paradigm has been extended in two ways for this study, in which the Noise and the Accent conditions are administered in a within-subject manner. Each participant is first exposed to the accent condition before the SNAP survey and returns to the noise condition. Between the two conditions, the practice and baseline trials remain identical.
4. Study overview
4.1 Participants
20 participants were recruited in Rochester, NY, and Irvine, CA (n=10 each, Figure 6). These two locations were chosen for their contrasting language landscapes, particularly their representation of languages other than English and the diversity of nonnative accents. The 2021 American Community Survey data (the United States Census Bureau, Table# B16001) was used to obtain objective estimates of participants’ ambient exposure to nonnative-accented speech. For instance, the numbers of foreign-born immigrants who speak Spanish at the county level were starkly different: The estimates will be ~25% in Orange County, where Irvine is located, as compared to <5% in Monroe County, where Rochester is located. The distributions, however, are likely more comparable between the campus populations at the University of Rochester and UC Irvine. We will come back to this point in General Discussion. For feasibility, the current study targeted college-aged individuals on the campuses of University of Rochester (UR) and UC Irvine (UCI). Although the sociolinguistic profiles of campus populations are expected to differ from those of off-campus populations, we believed that participants at the two sites would have different language input because of their surroundings. Recruiting these participants was done using flyers distributed at both the UR and UCI. This distribution happened via word of mouth and various online platforms.
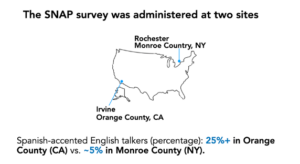 Figure 6 – The current study took place in two geographical locations with starkly different linguistic diversity profiles: Rochester (Upstate NY) and Irvine (Southern California)
We began with two exclusion criteria: (1) Participants must be between the ages of 18 and 40; and (2) participants must be native, monolingual speakers of English. Exclusion criteria (1) was established because we wanted to constrain our subject pool to adults who had not experienced significant hearing loss yet. Exclusion criteria (2) was created to ensure that participants would not have prior experience with other languages, which may increase their prior accent experience. Furthermore, individuals who speak another language may also have more input from other bilingual speakers, even in English. This may cause bilingual individuals to receive more accented-English input. Due to time constraints on recruitment, we modified criterion (2). As a result, two of the participants at UCI did not meet this criterion.. The average age of participants across both cities was 21 and the gender distribution was 11 males and 9 females.
4.2 Methods
The participant experience is shown in Figure 7. It begins when a participant sends an email to the research team, which triggers an automatic email response containing onboarding instructions about (a) downloading the ExpiWell app, (b) the intake questionnaire on the app, and (c) scheduling a Zoom meeting with the team for some further onboarding processes. The Zoom meeting consists of three parts. The first part verifies that the participant is set up on the app and ready for the bulk of the surveys to begin. The second part is a Long Form Questionnaire about their demographic information and past language experience (see Appendix I). The last part of the Zoom meeting entails a Perceptual Experiment (Section 3), where participants received the stimuli from the noise condition. Upon completion of the perceptual experiment, the SNAP survey begins on the next day.
After finishing the bulk of the experiment, participants proceed to the second Perceptual Experiment (the Accent condition), which marks the end of their time as a participant in the study, and they receive a $50 Amazon Gift Card via email.
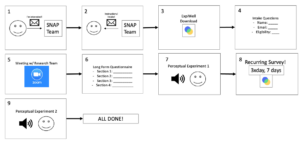 Figure 7 – Full participant experience outline, showing each of the steps that a participant undergoes as they proceed through the study. Each of these nodes may take a different amount of time for different participants.
4.3 Results
In this section, the responses given to the questions described in Section 2.4 are summarized. The 20 participants responded to 351 surveys out of the 420 surveys for which they were notified (which is a 84% response rate). All notifications were sent out to all participants, and the app had no issues, meaning that all “missed” notifications were due to participant negligence. The rates of missed notifications were higher in the morning (13%) as compared to the other two time-windows (9% in the afternoon and 9% in the evening). Nonetheless, the overall high rate of responses supports the validity of the current protocol.
Q2. In the past hour, did you listen to any speech?
284 out of 351 (81%) of the responses indicated that participants had received some linguistic exposure (Figure 8). The remainder of the data report will be focused on the cases where participants responded “Yes” to this question.
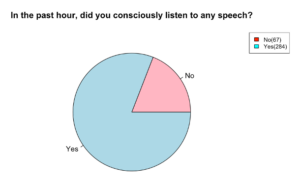 Figure 8 – Conscious speech reporting: showing a significantly higher number of participants who were coming into contact with speech in the past hour, when prompted with the survey.
Q3. Interactive vs. passive / In-person vs. online?
The four options (shown in Figure 9) were generated in a 2×2 manner. One of the distinctions was between “just listening” and “interactive”, which outlines the quality of speech interaction, and whether there would have been room for hands-on engagement with an accent, rather than just passive listening. The other distinction occurs between “in-person” and “online” speech. This distinction is necessary because of prior research outlining the differences in language acquisition and proficiency when exposed to stimuli through media versus in person (Lytle et al., 2018). The responses suggested that when participants were using language interactively, they were more likely to do so in person than online (including a phone call). On the other hand, when they were passively listening to language, they were likely doing so online rather than in person.
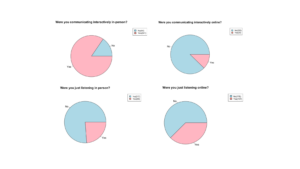 Figure 9 – Responses to the questions regarding whether individuals were engaging with speech passively, just listening.
Q5. Whose speech did you listen to?
Figure 10 summarizes the relationships between our participants and their primary conversational partners. Participants were permitted to respond “Yes” in a checkbox manner (i.e., allowed to select multiple answers during the survey). The results display that the participants responded to friends and strangers the most,which gives valuable insight regarding their linguistic experiences in a naturalistic and time-locked manner.
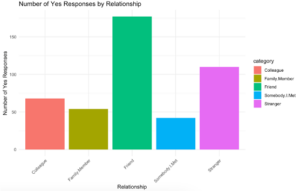 Figure 10 – Breakdown of the people with whom our participants interacted throughout all surveys. Participants could respond that they conversed with more than one of these individuals in each survey response.
Q6. What language did you communicate in?
This question, in other circumstances with more resources and subject selection abilities, could be used to ensure that participants were conversing only in English. For us, it is used to showcase whether there is any linguistic diversity in the participant’s speech. The results show that participants were conversing mainly in English (97%), with some individuals speaking in Cambodian, Vietnamese, and Chinese.
Q7. In the past hour, how many people did you speak with?
The number of speakers varied from 1 to 50 (mean = 5.26) (Figure 11). In general, participants were interacting with a larger number of speakers during the afternoon (mean = 5.96) as compared to in the morning or the evening.
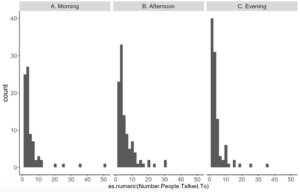 Figure 11 – The number of speakers that participants have listened to in the past hour, split up by the different timeframes in which surveys were distributed
Q8,9,10. In the past hour, did you speak to anyone with a Chinese, Spanish, or other accent?
It was expected that participants at the Irvine site would be more likely to answer “yes” to these questions due to the more diverse linguistic representation in Southern California. On the contrary, overall data were similar across the two sites. The “yes” responses for a Chinese accent were slightly more frequent at the Irvine site (31/135, 23%) than at the Rochester site (22/145, 15%) (Figure 12). However, the proportions were reversed for a Spanish accent (9% vs. 19%) (Figure 13) and comparable for any other accent (24% vs. 25%) (Figure 14). This was likely due to the fact that the current participants were college students, whose daily linguistic interactions occur on campus with large bodies of international students.
 Figure 12 – The number of respondents that heard a Chinese accent in the past hour (Left = Rochester, Right = Irvine)
 Figure 13 – The number of respondents that heard a Spanish accent in the past hour(Left = Rochester, Right = Irvine)
 Figure 14 – The number of respondents that heard any type of OTHER accent in the past hour, excluding Chinese and Spanish accents
To better understand the differences between the two sites, as well as individual differences in accent exposure, I have summarized the participant’ responses. Figure 15 represents the “yes” responses to question 8. This is shown to provide an example of the individual variation for one of the questions, showcasing the power of the SNAP survey. Next, Figure 16 is a combination of questions 8-10, highlighting the individual variation that occurs throughout these three questions. There are some underlying trends that appear when viewing Figure 16. First, there were a few individuals at both sites who never answered “yes” to any of these questions (e.g., participant 1002 at Rochester and participant 2001 at Irvine). Second, and in contrast, a few subjects answered “yes” at a much higher rate than others. For example, participant 1010 consistently answered “yes” to all three of these questions, suggesting that they were likely interacting with speakers from different linguistic backgrounds. Finally, there are a few others who answered “yes” to a particular question (i.e., a particular non-native accent) but not to others. For example, participant 1596 (at Irvine) frequently answered “yes” to questions 8 (a Chinese accent) and 10 (any other non-native accent), but not to question 9 (a Spanish accent). These patterns support the idea that individuals vary significantly in their exposure to accents, even in the same geolocation, and that SNAP surveys can effectively capture these individual differences.
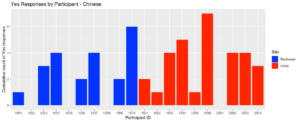 Figure 15 – The individual breakdown for Chinese of how participants respond throughout the survey, and how many times they reported hearing Chinese accents in the past hour. The participant ID 1001 – 1010 were from the Rochester site and 1501-2004 were from the Irvine site.
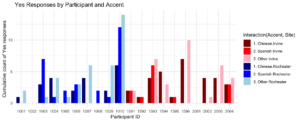 Figure 16 – The individual breakdown of how participants respond throughout the survey questions 8-10, and how many times they reported hearing Spanish accents in the past hour. The participant ID 1001 – 1010 were from the Rochester site and 1501-2004 were from the Irvine site.
Comparisons Across Participants
The SNAP survey questions, as they stand, are able to generate three dimensions of accent experience information,including Chinese, Spanish, and other accented English. These dimensions are represented by the quantity of “yes” responses and can be plotted as such.
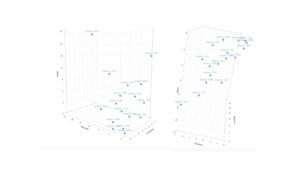 Figure 17 – These graphs show a 3-dimensional plot of the data collected by the SNAP survey. These points are all representations of where each individual lies within the 3-dimensional space.
This plot is effective at capturing the diverse nature of the relationship between different types of accent experience. Naturally, individuals will not have the same experience levels with all accents, but it does seem to hold that high exposure to one accent is an adequate indicator of high exposure to other accents, as well.
What remains to be explored, though, is the relationship between this exposure at different sites, which is discussed below.
Comparisons Across Locations
The nature of exposure across diverse and homogenous locations is a core tenet to this thesis. Hence, a matrix of graphs is useful to showcase the differences between these locations. The lower level of the below graph (Figure 18) is a linear model representation of each of the three relationships between accents. This model helps us bolster our above argument. It furthers the argument that as one type of accent experience increases, so do the others. The linear model is especially indicative of a linear relationship between Chinese and Spanish accent experience.
Next, the middle layer helps us answer the question of location differences in responses. As the two shadings are primarily shown in overlap, we are able to determine that the densities of responses which indicate that accent experience overlap . This suggests that there is very little difference in accent experience between the two sites.
The overall density, across both sites, displayed in the 2-dimensional graph in the upper layer, is powerful in showing where the responses primarily clump for each accent experience relationship.
All of these layers allow us to conclude that there is significant difference in individual variation, but that this difference does not appear across location (diverse vs. homogeneous).
 Figure 18 – These graphs show three levels of comparison, discussed above. They are useful in disambiguating the differences in location accent experience (especially the second layer). The layers are: lower = linear model of participant accent experience reporting, middle = density plot of responses across both locations, upper = 2-dimensional plot of the density of responses across each 2-dimensional space.
Perceptual Experiment Results
Figure 19 summarizes the perceptual experiment results from both sites. Irvine is represented as the “diverse” location due to the heterogeneous nature of its language profile compared to Rochester. Overall, Rochester participants responded similarly to participants in Clarke and Garrett (2004) and Xie et al. (2018) in that their RTs (response times) decreased steadily throughout the exposure phase in both the accent and noise conditions. Their RTs at test did not differ between conditions, which may be due in part to the small sample size. In contrast, the Irvine participants showed a different trend which showed much more variability in the accent condition and they performed better (numerically) on the accented test speaker after exposure to native speech in noise.
The lack of significant effect of the condition on RT in Rochester, may be due to within-participant carryover from the accent condition to the noise condition. Despite the 7-day interval, participants may have been able to recall the experiences in the accent condition and apply them in the noise condition. As for the increased response variability in the accent condition in Irvine, this could be due to the greater heterogeneity among the participants (e.g., 2/10 were not monolingual English speakers). We will continue to examine their long-form questionnaire responses to explore possible sources of the response variability. More generally, the results suggest that researchers should exercise caution and significant randomization protocols when conducting a within-subjects design and using this paradigm.
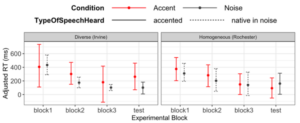 Figure 19 – The progression of participants through the experimental paradigm: the three exposure blocks into the test block. Each site has 10 participants, who participated in the accent vs, noise condition before and after the 7 day SNAP survey.
A next step to investigate is this paradigm’s interaction with the SNAP data. As it stands, the most effective way to achieve this would be appending test block reaction time data to the SNAP data. Specifically, the SNAP data should outline the percentage of surveys in which each individual responded “yes” to each accent. By analyzing these percentages alongside the reaction times, and discussing whether lower reaction times correspond to higher percentages (especially for Chinese accents), we would be able to effectively combine these measures.
5. General discussion
While effects of long-term linguistic experience on accent adaptation have been widely assumed, few empirical tests are currently available. This thesis put forward a new experience-based sampling method implemented as a mobile-based survey (SNAP). Participants responded to the SNAP survey over seven days, and participated in the perceptual experiment from Xie et al. (2018) twice in two conditions, “accent” and “noise”. By involving participants at two different sites, Rochester, NY and Irvine, CA, I provided a proof-of-concept validation of the SNAP survey in multiple areas in the United States. Encouragingly, the survey delivery was seamless with no technical issues, and the response rate was high (84%). This supports the feasibility of the current SNAP survey protocol. This data will provide additional insights into what future iteration of the SNAP protocol can tell us about the long-term effects of accent exposure.
In the study, we found that participants routinely experience language exposure throughout the day, with a larger number of talkers during the day than in the morning or evening. However, it is important to keep in mind that there was a greater instance of missed notifications in the morning. This could mean that the samples in the morning were noisier than those in the afternoon or in the evening. The most prominent type of interaction was communicating interactively in-person at 85% (241/285). The least prominent mode of interaction was communicating interactively online at 12% (35/285).
Importantly, and contrary to our original expectations, the accent exposure data at the two sites were largely comparable with each other. For example, participants in Irvine reported hearing Chinese-accented English in 23% (31/135) of the surveys they received while participants in Rochester reported hearing Chinese-accented English in 15% (22/145) of their surveys. These proportions were reversed for Spanish-accented English, while they were equivalent for other accents. The by-participant analysis suggested that the observed similarity emerged from interesting individual differences. Some participants (e.g., 1010) reported on a much higher rate of exposure to multiple accents than some others who reported having none. Our results(Figures 8-19), indicate that high exposure in one accent likely suggests high exposure across all accents. These points yield support to the idea that individuals vary widely in terms of their accent exposure and familiarity. Individualized measures like SNAP will be a useful and instructive supplement for geolocation-based estimates of SOLID.
The biggest hurdle was to integrate the SNAP survey into a larger study workflow including the subject intake, the long-form questionnaire, and perceptual experiments. In the current implementation, the study team must be very hands-on with participant registration and progress monitoring. We met with each participant via Zoom to go over the study procedure as well as to provide instructions for the surveys and the perceptual experiments. Whereas this was effective in terms of ensuring task compliance and ensuring eligibility criteria (e.g., monolingual status of the participant), it will be prohibitively expensive and therefore unattainable as the study scales up in size. We have created an instruction video (https://vimeo.com/924986229) to aid this process. In the future, we should implement a self-paced registration process with eligibility check questions to streamline this process and eliminate the need for individual zoom sessions.
As discussed in Section 1.1, one of the instruments uses the US census data of speakers of non-English languages. One previously tested hypothesis is that listeners who are in a region of the US with a more diverse linguistic profile would be better at adapting to a talker with an unfamiliar accent than those who are in a more linguistically homogeneous region (Xie et al., 2023).
These results could support two mutually compatible possibilities. The first is that adaptation through short-term exposure is so powerful that it overrides whatever individual differences may exist at the start of the experiment. The second is that a zip code area, let alone a state, is too coarse a unit of analysis. Individuals within each area/state represent highly heterogeneous linguistic experiences, and grouping like this dilutes individual differences in accent familiarity. The results of the study reported above shed light on such heterogeneity. If this is the case, the SNAP survey may be able to provide a more fine-grained, individualized measure of accent exposure. In a future iteration, we plan to administer SNAP with a larger group of participants recruited from different regions across the US. In doing so, we aim to provide a more rigorous test of the hypothesis about prior linguistic exposure and its effects on short-term, rapid accent adaptation.
In conclusion, the SNAP survey provides a unique predictor of the data collected in the perceptual experiment (e.g., cross-modal priming). From the simple, time-locked surveys administered throughout the day, researchers are able to accurately track the amount of accent exposure to infer the individual participant’s accent familiarity. Combined with the other SOLID measures, the SNAP survey will fill in the blanks in terms of an individualized estimate of accent experience and its impacts on adaptive speech perception.
6. References
Arndt, H. L., Granfeldt, J., & Gullberg, M. (2023). Reviewing the potential of the Experience Sampling Method (ESM) for capturing second language exposure and use. Second Language Research, 39(1), 39-58. https://doi.org/10.1177/02676583211020055
Clarke, C. M., & Garrett, M. F. (2004). Rapid adaptation to foreign-accented English. The Journal of the Acoustical Society of America, 116(6), 3647–3658. https://doi.org/10.1121/1.1815131
Gilkerson, J., Richards, J. A., Warren, S. F., Montgomery, J. K., Greenwood, C. R., Kimbrough Oller, D., Hansen, J. H. L., & Paul, T. D. (2017). Mapping the Early Language Environment Using All-Day Recordings and Automated Analysis. American Journal of Speech-Language Pathology, 26(2), 248–265. https://doi.org/10.1044/2016_AJSLP-15-0169
Goodman, F. R., Kelso, K. C., Wiernik, B. M., & Kashdan, T. B. (2021). Social comparisons and social anxiety in daily life: An experience-sampling approach. Journal of abnormal psychology, 130(5), 468–489. https://doi.org/10.1037/abn0000671
Gordon-Salant, S., Yeni-Komshian, G. H., Fitzgibbons, P. J., & Schurman, J. (2010). Short-term adaptation to accented English by younger and older adults. The Journal of the Acoustical Society of America, 128(4), EL200–EL204. https://doi.org/10.1121/1.3486199
Griffiths, R. (1990). Speech Rate and NNS Comprehension: A Preliminary Study in Time‐Benefit Analysis. Language Learning, 40(3), 311–336. https://doi.org/10.1111/j.1467-1770.1990.tb00666.x
Gu, Y., Cutler, S., Xie, X., & Kurumada, C. (2023, November 16-19). Rapid speech adaptation under adverse listening conditions. The 2023 annual meeting of Psychonomics Society, San Francisco, CA, United States.
Hazan, V., Messaoud-Galusi, S., Rosen, S., Nouwens, S., & Shakespeare, B. (2009). Speech Perception Abilities of Adults With Dyslexia: Is There Any Evidence for a True Deficit? Journal of Speech, Language, and Hearing Research, 52(6), 1510–1529. https://doi.org/10.1044/1092-4388(2009/08-0220)
Kleinschmidt, D. F., & Jaeger, T. F. (2015). Robust speech perception: recognize the familiar, generalize to the similar, and adapt to the novel. Psychological review, 122(2), 148–203. https://doi.org/10.1037/a0038695
Lev‐Ari, S., Ho, E., & Keysar, B. (2018). The Unforeseen Consequences of Interacting With Non‐Native Speakers. Topics in Cognitive Science, 10(4), 835–849. https://doi.org/10.1111/tops.12325
Lytle, S. R., Garcia-Sierra, A., & Kuhl, P. K. (2018). Two are better than one: Infant language learning from video improves in the presence of peers. Proceedings of the National Academy of Sciences, 115(40), 9859–9866. https://doi.org/10.1073/pnas.1611621115
Magnuson, J. S., Nusbaum, H. C., Akahane-Yamada, R., & Saltzman, D. (2021). Talker familiarity and the accommodation of talker variability. Attention, Perception & Psychophysics, 83(4), 1842–1860. https://doi.org/10.3758/s13414-020-02203-y
Núñez-Méndez, E. (2022). Variation in Spanish /s/: Overview and New Perspectives. Journal of Imaging, 7(2), 77. https://doi.org/10.3390/jimaging7020077
Porretta, V., Buchanan, L., & Järvikivi, J. (2020). When processing costs impact predictive processing: The case of foreign-accented speech and accent experience. Attention, Perception, & Psychophysics, 82(4), 1558–1565. https://doi.org/10.3758/s13414-019-01946-7
Richards, J. A., Xu, D., Gilkerson, J., Yapanel, U., Gray, S., & Paul, T. (2017). Automated Assessment of Child Vocalization Development Using LENA. Journal of Speech, Language, and Hearing Research, 60(7), 2047–2063. https://doi.org/10.1044/2017_JSLHR-L-16-0157
Tamasi, S., & Antieau, L. (2014). Language and Linguistic Diversity in the US (1st ed.). Routledge. https://doi.org/10.4324/9780203154960
U.S. Census Bureau. (2024). 2018-2021 American Community Survey 3-year Public Use Microdata Samples. U.S. Department of Commerce. https://www.census.gov/programs-surveys/acs/data.html
Witteman, M. J., Weber, A., & McQueen, J. M. (2013). Foreign accent strength and listener familiarity with an accent codetermine speed of perceptual adaptation. Attention, perception & psychophysics, 75(3), 537–556. https://doi.org/10.3758/s13414-012-0404-y
Xie, X., Weatherholtz, K., Bainton, L., Rowe, E., Burchill, Z., Liu, L., & Jaeger, T. F. (2018). Rapid adaptation to foreign-accented speech and its transfer to an unfamiliar talker. The Journal of the Acoustical Society of America, 143(4), 2013–2031 https://doi.org/10.1121/1.5027410
Appendix
7.1 Appendix: long form questionnaire contents
Section 1: Personal Information and Listening Experience
- Age (years)
- Gender
- Male
- Female
- Both/neither/something else
- Race/Ethnicity
- American Indian or Alaska Native
- Asian
- Black or African American
- Hispanic or Latino
- Native Hawaiian or Other Pacific Islander
- White
- Zip Code
- Native (first) language(s)
- Have you ever had a hearing, speech, or language disorder?
- Yes
- No
Section 2: Family and Residential History
- Please list the primary places (city, state) where your parents grew up.
- Please list the primary places (city, state) where your spouse, partner, and/or roommates grew up.
- Please list all of the places (city, state) that you lived BEFORE age 18, how long you lived in each place, and how old you were when you lived there.
- Please list all of the places (city, state) that you lived AFTER age 18, how long you lived in each place, and how old you were when you lived there.
- Using the map as a guide, please note all of the states you visit at least once per year.
Section 3: Regional Dialect Information
- This map shows six regions where different dialects of American English are spoken.
- Please mark the regional dialect of American English that you speak based on the map above.
- Please select the regional identity or identities that you feel describe you.
- Please select the cultural identity or identities you identify with most.
- Urban
- Suburban
- Rural
- Other
Section 4: Language Exposure and Experience
- Please select the choice that best describes your language background.
- I speak American English only
- I speak language other than English proficiently
- Do your parents have a foreign accent while speaking English?
- Yes
- No
- They do not speak English
- Please list the native language(s) of your current spouse, partner, and/or roommates
The next subsection asks you to list the number of years and months you have spent in each language environment.
- A country where Spanish is spoken
- A family where Spanish is spoken
- A school/working environment where Spanish is the dominant spoken language
- A country where Mandarin is spoken
- A family where Mandarin is spoken
- A school/working environment where Mandarin is the dominant spoken language
On a scale from zero to nine, with higher numbers corresponding to higher proficiency, please indicate your level of proficiency in…
- Speaking Spanish
- Understanding Spanish
- Reading Spanish
- Speaking Mandarin
- Understanding Mandarin
- Reading Mandarin
On a scale from zero to nine (with higher numbers corresponding to more exposure), please rate to what extent you are currently exposed to SPANISH in the following contexts.
- Interacting with friends
- Interacting with family
- Watching TV
- Listening to radio/music
- Reading
- Language-lab/self-instruction
On a scale from zero to nine (with higher numbers corresponding to more exposure), please rate to what extent you are currently exposed to MANDARIN in the following contexts
- Interacting with friends
- Interacting with family
- Watching TV
- Listening to radio/music
- Reading
- Language-lab/self-instruction
Section 5: Nonnative Accent Exposure
- How would you best describe your familiarity with Chinese-accented (Mandarin and Cantonese) English?
- Very familiar. I can always tell whether the person speaks with this particular accent.
- Moderately familiar. I can often tell whether the person speaks with this particular accent.
- Somewhat familiar. I can sometimes tell whether the person speaks with this particular accent.
- Not familiar at all. I am not able to tell if the person speaks with this particular accent.
- How would you best describe your familiarity with Spanish-accented English?
- Very familiar. I can always tell whether the person speaks with this particular accent.
- Moderately familiar. I can often tell whether the person speaks with this particular accent.
- Somewhat familiar. I can sometimes tell whether the person speaks with this particular accent.
- Not familiar at all. I am not able to tell if the person speaks with this particular accent.
- Please list below if you have regular exposure to other types of accented English.
Section 6: General Comment
- Is there anything else that you would like to comment on in terms of your language background?
About the Author
Seth Cutler is a 2024 graduate of the University of Rochester. He majored in Brain and Cognitive Sciences, Linguistics, and Spanish and conducted this work, his honors thesis, in BCS. Since graduation, Seth has gone on to become a research fellow at the National Institutes of Health, working with intellectual disability through the lens of neuropsychological methods. He plans on continuing his academic journey through a Ph.D. at the end of his fellowship.
Cite this Article
Cutler, S. H., Xie, X., Gu, Y., Eclevia, B., Kurumada, C. (2024). An experience-based sampling approach to examining prior experience in adaptive speech perception. University of Rochester, Journal of Undergraduate Research, 23(1). https://doi.org/10.47761/XOSM6218
JUR | Creative Commons Attribution 4.0 BY International License
