
Report on Investment Performance for the fiscal year ending June 30, 2018
The market value of the University of Rochester’s Long Term Investment Pool (“LTIP”) as of June 30, 2018 was $2.5 billion. Performance for the year was 10.0%, net of all fees and expenses, compared with the benchmark return of 8.6%. Performance of the LTIP has exceeded the benchmark, net annualized, for five, ten, and fifteen year periods. Performance was slightly below the benchmark, net annualized, for the three year period.
Asset Allocation and Performance
The chart below shows allocation targets and ranges compared to actual allocations on June 30, 2018.
**Committee approval in September 2016, effective until December 31, 2018. May not foot due to rounding
| Target | Actual* | + / – | Range** | ||
| Traditional Investments Consisting of: | |||||
| Total, Publicly-traded long equities | 35 | 32 | (3) | 34 – 36 | |
| Fixed Income | 4 | 5 | 1 | 4 – 6 | |
| Cash (not held by managers) | 3 | 1 | (2) | (3) – 3 | |
| Total, Traditional Investments | 42 | 38 | (4) | 35 – 45 | |
| Alternative Investments Consisting of: | |||||
| Hedge Funds | 25 | 27 | 2 | 25-28 | |
| Private Equity / Distressed | 21 | 22 | 1 | 19 – 23 | |
| Real Assets | 12 | 13 | 1 | 11 – 14 | |
| Total, Traditional Investments | 58 | 62 | 4 | 55 – 65 | |
| TOTAL | 100 | 100 | (0) | 100 | |
The LTIP’s 62% alternative investment allocation consists of hedge funds and partnerships investing in real assets and equities of private companies. The alternative investment program has outperformed the “traditional” stock and bond portfolio for one, three, five, ten, and fifteen year periods. The alternative allocation is near the mean allocation to alternatives of the largest educational endowments. The LTIP alternative program demonstrated significantly lower volatility of return, with alternative volatility of 4.4% for the ten years ending June 30, 2018 compared to 6.9% for the LTIP. Importantly, the LTIP’s alternative program generated attractive returns in periods of weak or negative performance by public equities and bonds, and is expected to continue to do so in the future.
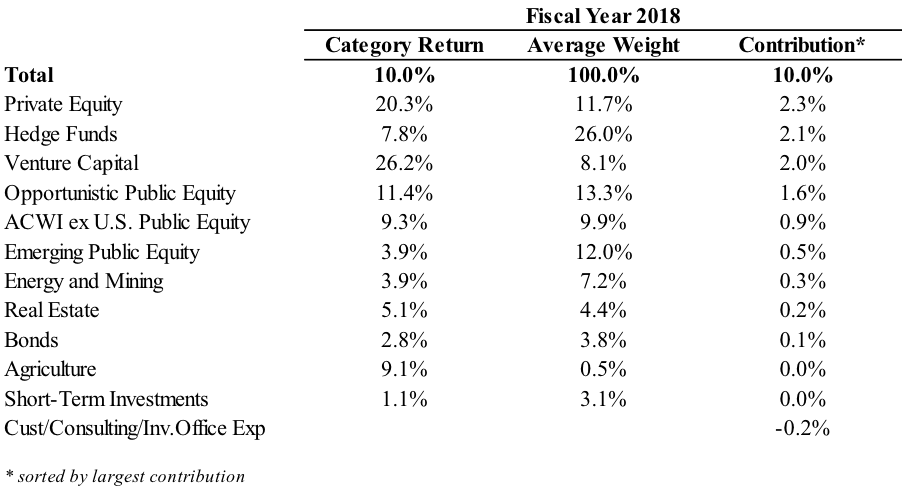
Comment on Asset Category Performance
The weights and contributions to return for asset classes as of June 30, 2018 are shown in the chart below.
Public Equities
The publicly-traded equity portfolio represented 32% of the total portfolio, below the target allocation of 35%. The publicly-traded equity portfolio returned 7.9% net for the fiscal year, below the 10.7% return for the MSCI All Country World Index (“ACWI”) primarily as a result of the LTIP’s overweighting of emerging markets equities. The publicly-traded equity portfolio outperformed the benchmark for the ten and fifteen year time periods and lagged for the three and five year periods.
Opportunistic public equities represented 12% of the LTIP at the end of June. The group returned 11.4% net for the fiscal year, above the 10.7% return for the ACWI. The group also outperformed the ACWI for the three, five, ten, and fifteen year time periods.
International public equity (ACWI ex-U.S. and emerging) represented 21% of the LTIP at the end of June. Performance for the fiscal year was 6.3% net, below the 7.3% return of the benchmark, the ACWI ex-U.S. The group outperformed the benchmark for the three, five, ten, and fifteen year time periods. Emerging markets, which represented more than half of the international public equity allocation, returned 3.9% net for the fiscal year, underperforming the 8.2% return of the benchmark, the MSCI Emerging Markets Index. For all longer periods, the emerging group outperformed the Index.
Hedge Funds
The hedge fund allocation was 27% at the end of June, above the target allocation of 25%. The hedge fund portfolio’s net return was 7.8% for the fiscal year. Equity-oriented managers returned 9.9% net, diversifiers returned 7.0% net, and the liquid diversifier manager returned 4.6% net. The hedge fund ten year net annualized return was 5.1%, below the 6.0% return of the LTIP benchmark. The fifteen year return of 7.3% was above the LTIP benchmark return of 7.2%.
Real Assets
Partnerships investing in real assets represented 13% of the LTIP at the end of June, slightly over the target. The real assets portfolio returned 4.5% net for the fiscal year. The net annualized return of 3.4% for the most recent five year period and ten year net annualized return of 0.4% are disappointing. Ten year results were impacted by the global financial crisis as well the decline in energy prices. The 8.5% return for fifteen years was above the LTIP benchmark return of 7.2%.
The LTIP’s real asset partnerships invest in energy/mining and real estate/agriculture. Energy and mining, a 9% allocation within the LTIP, returned 3.9% net for the fiscal year. The ten year net annualized return for energy and mining was -2.6% and the fifteen year return was 10.3%. Real estate and agriculture, a 4% allocation within the LTIP, returned 5.5% net for the fiscal year. The ten year net annualized return for real estate and agriculture was 2.0% (the fifteen year return is not available since the program did not exist prior to that time period).
Private Equity
The LTIP’s private equity portfolio consists of partnerships investing in buyouts/growth, distressed/credit, and venture capital, and represented 22% of the LTIP at the end of the fiscal year, slightly above the target allocation of 21%. Private equity returned 22.7% net for the fiscal year; the ten year net annualized return was 13.3% and the fifteen year return was 14.4%.
Buyouts, the largest strategy allocation within private equity at 11%, returned 23.2% net for the fiscal year. Venture capital, representing 9% of the LTIP, returned 26.2% net for the fiscal year. Distressed, a 2% allocation within the LTIP, returned 8.3% net for the fiscal year. Ten year net annualized returns for these subcategories were 12.0%, 15.9% and 11.6%, respectively. Fifteen year returns were 13.4%, 13.0%, and 12.3%, respectively.
Fixed Income
The allocation to fixed income and cash equivalents represented 6% of the LTIP. For the fiscal year, the LTIP’s fixed income and cash investments returned 1.9% net, compared to 0.2% for the blended bond/cash index. The ten year net annualized return for fixed income and cash was 3.6% (4.7% for bonds), compared to the return of 3.8% for the blended index. The fifteen year return for fixed income and cash was equal to the blended index at 3.8% (4.6% for bonds).
Liquidity
The LTIP has ample liquidity, with 62% of assets convertible into cash within one year.
Investment Reports for Previous Years »