
Report on Investment Performance for the fiscal year ending June 30, 2020
On June 30, 2020, the market value of the University of Rochester’s Long Term Investment Pool (“LTIP”) was $2.6 billion. Performance for the fiscal year was 3.7%, net of all fees and expenses, compared with the benchmark return of 2.9%. Performance of the LTIP exceeded the benchmark, net annualized, for one, three, five, and ten years.
Asset Allocation and Performance
The table below shows the LTIP’s asset allocation at the end of the fiscal year compared to 2020 targets and ranges.
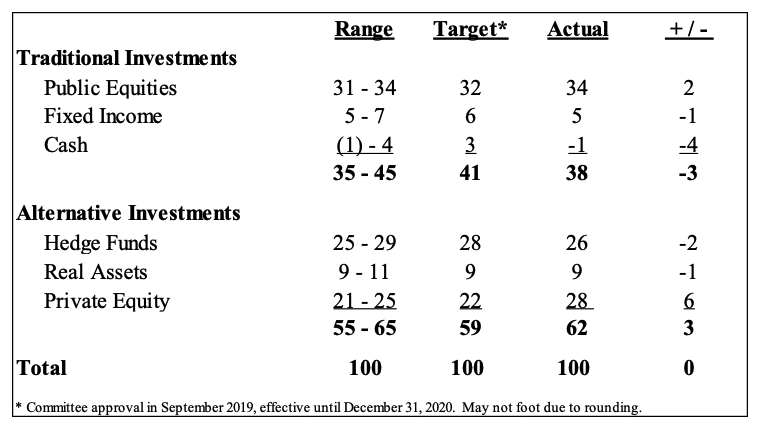
The LTIP’s 62% alternative investment allocation, consisting of hedge funds, private equity, and real assets, outperformed the LTIP and its benchmark for all periods. Volatility of return for the alternatives program was 3.8% annualized for the ten years ending June 30, 2020. This compares to ten-year volatility of 5.8% for the LTIP and 11.2% for the LTIP benchmark.
Comment on Asset Category Performance
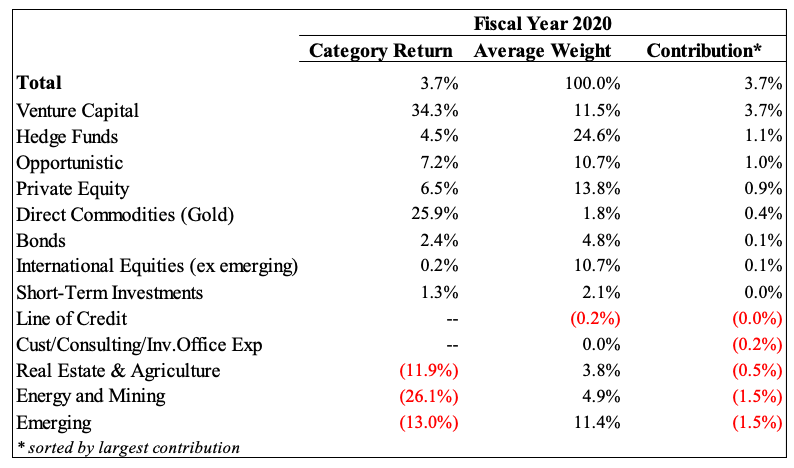
The contributions to return for the fiscal year, ranked in descending order by contribution, are shown in the chart below.
Publicly-Traded Equities:
Publicly-Traded Equity funds represented 33.6% of the LTIP at the end of June, slightly above its target allocation of 32%, but in line with its range of 31% to 34%. In aggregate, the Publicly-Traded Equity portfolio declined 2.5% (net) for the fiscal year, underperforming the 2.1% gain in the LTIP Publicly-Traded Equity index. The Publicly-Traded Equity portfolio is comprised of three allocations: Opportunistic (11.9%), International Developed (ACWI ex US) (10.9%), and Emerging Markets (10.9%).
The Opportunistic allocation contributed to returns, returning 7.2% for the fiscal year, in excess of the 2.1% return of its benchmark, the MSCI All Country World Index. Over five- and ten-year periods, the allocation has returned 7.2% and 12.2% (net annualized), which exceeded the respective 6.5% and 9.2% benchmark returns.
The International Developed equity allocation returned -6.8% for the fiscal year, underperforming the -4.8% return of its benchmark, the MSCI All Country World Index ex US. Over five- and ten-year periods, the allocation has returned 2.1% and 4.9% (net annualized), slightly underperforming the respective 2.3% and 5.0% benchmark returns. The value-tilt of the International Developed allocation has detracted from performance.
The Emerging Markets equity allocation returned -13.0% for the fiscal year, underperforming the -3.4% return of its benchmark, the MSCI Emerging Markets Index. Over five- and ten-year periods, the allocation has returned 1.0% and 3.0% (net annualized), underperforming the respective 2.9% and 3.3% benchmark returns. Underweights to China and growth stocks in emerging markets detracted from performance.
Hedge Funds:
Hedge funds represented 26.0% of the LTIP at the end of June, slightly below its target allocation of 28%, but in line with its range of 25% to 29%. In aggregate, the hedge fund portfolio rose 4.5% (net of all fees) for the fiscal year, outperforming the LTIP’s policy benchmark by 1.6%, with less than half of the volatility (7.5% standard deviation for the hedge fund portfolio vs. 16.5% for the LTIP’s policy benchmark). The hedge fund portfolio is comprised of an Equity-oriented portfolio (14.8% allocation) and a Diversifier portfolio (10.9% allocation). For the fiscal year, the Equity-oriented portfolio generated a net return of 6.6%, while the Diversifier portfolio generated a net return of 2.4%.
The hedge fund portfolio has generated net annualized returns of 4.1% and 6.5% over the trailing five and ten years, respectively. The Equity-oriented portfolio generated net annualized returns of 4.1% and 7.8% over the trailing five and ten years, respectively, outperforming the Credit Suisse Long/Short Equity Hedge Fund Index, which returned 2.7% and 5.2% over the same time periods. The Diversifier portfolio generated net annualized returns of 3.8% and 5.4% over the trailing five and ten years, respectively, compared to 3.0% and 5.7% for the Credit Suisse Multi-Strategy Hedge Fund Index.
Real Assets:
Real assets represented 8.5% of the LTIP at the end of June, consistent with the 9% target. The LTIP real assets portfolio declined 13.3% for the fiscal year. Losses were primarily driven by the -26.1% return of energy and mining funds, where oversupply and COVID-driven demand contractions contributed to weak energy prices, impacting the portfolio. Real estate declined by 12% as legacy international funds return -19.8%, and domestic funds experienced modest COVID-driven write-downs and returned -7%. While real assets funds declined 20.2% in fiscal 2020, the allocation to gold partially offset those losses by returning 25.9% for the year.
Net annualized returns of 0.1% for the past five years and 2.5% for the past ten years are disappointing, with real assets impacted by weak commodity prices for energy and mining funds, and poor performance in legacy real estate funds, predominantly in the international funds. Domestic real estate, where opportunistic commitments have continued, returned 6.6% and 11.6% for five and ten years, respectively. Since the gold position was added to the LTIP (October 2017), it has generated a 12% annualized return.
Private Equity:
Private Equity represented 27.7% of the LTIP at the end of June, above the upper end of the 21% to 25% range (and above the target of 22%). Although the pacing of new commitments to private equity firms slowed down considerably from prior years, the allocation grew above the range due to the increased pace of capital calls from managers, as well as the significant outperformance of private equity funds compared to the rest of the LTIP. The portfolio rose 18.8% for the fiscal year. Venture capital comprised 13.8% of the LTIP, and was the main performance driver for the private equity portfolio (and the LTIP overall), rising 34.3%. Buyouts/growth comprised 11.8% of the LTIP, and gained 6.5% for the year. Distressed managers (2.1% of the LTIP) rose 6.1%.
Net annualized returns of 16.0% for the past five years and 17.7% for the past ten years are the best results by a significant margin for any asset class in the LTIP. These returns were bolstered by the strong equity markets of the past decade and the consistent outperformance of the LTIP’s largest venture capital manager (which is also its largest relationship overall). Venture capital was the top performing segment for those time periods, returning 21.3% for five years and 25.2% for ten years, with buyouts/growth second at 13.1% and 14.4%, respectively. The distressed segment had a muted return of 4.9% for the past five years, but the recovery period from the financial crisis led to stronger ten year returns of 10.1%.
Fixed Income (Bonds and Cash):
Bonds (excluding cash) represented 4.8% of the LTIP at the end of June, below its target allocation of 6%, and slightly below the lower end of its range of 5% to 7%. Cash represented 0.3%, with the Line of Credit drawn for 0.9%, resulting in a net cash position of -0.6%, below its target of 3%, but within its range of -1% to 4%. In aggregate, the Fixed Income (including cash) portfolio rose 2.6% (net) for the fiscal year, with bonds driving these returns with a 2.4% return, and the allocation to cash rising 1.3%. Cash levels were temporarily low at the turn of the fiscal year due to manager re-balancing and new allocations.
The fixed income (including cash) portfolio has generated net annualized returns of 2.7% and 2.8% over the trailing five and ten years, respectively, modestly underperforming the respective total fixed income benchmark returns of 2.9% and 3.1%.
Liquidity
The LTIP has ample liquidity, with 51% of assets convertible into cash within one year.