
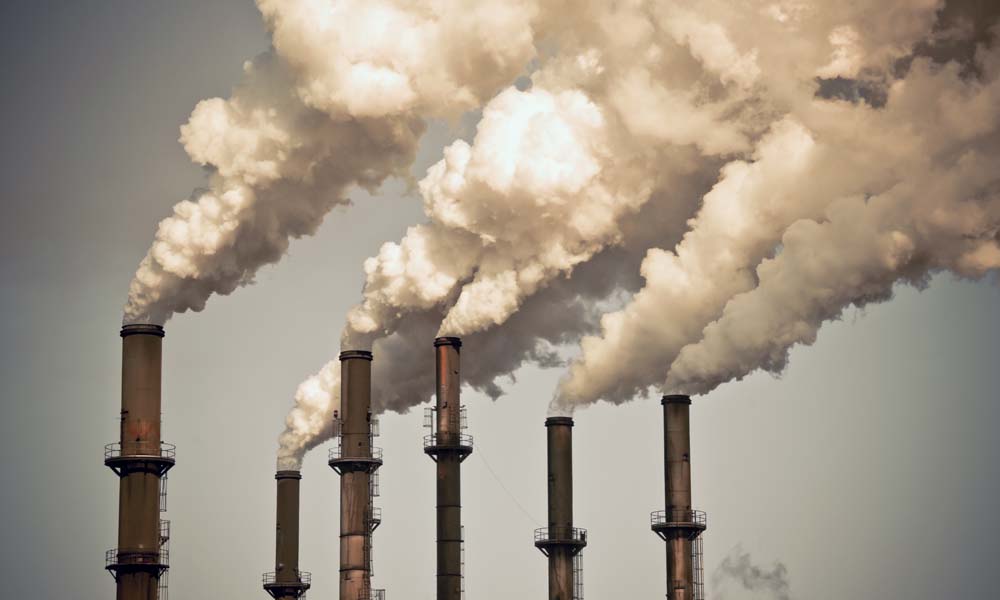
Ozone near Earth’s surface is a powerful greenhouse gas that is a main component of urban pollution. In the last few decades, scientists have traced an increase in the concentration of this ground-level ozone to rapid industrialization in the last century.
However, the magnitude of this increase has been unclear. In order to estimate changes in the levels of ground-level ozone since the preindustrial era, researchers rely on computer models such as those developed by Lee Murray, an assistant professor of Earth and environmental sciences at the University of Rochester.
But how accurate are these models?
To find out, researchers from France and the United States, including Murray, examined rare oxygen molecules trapped in air bubbles in old ice and snow to compare how well the ice-core record matched model predictions. Their results, published in the journal Nature, suggest good news regarding the reliability of the models—as well as ways researchers can better predict how humans are changing the chemistry and climate of Earth’s atmosphere.
What is ozone? “Good” (stratospheric) ozone versus “bad” (tropospheric) ozone
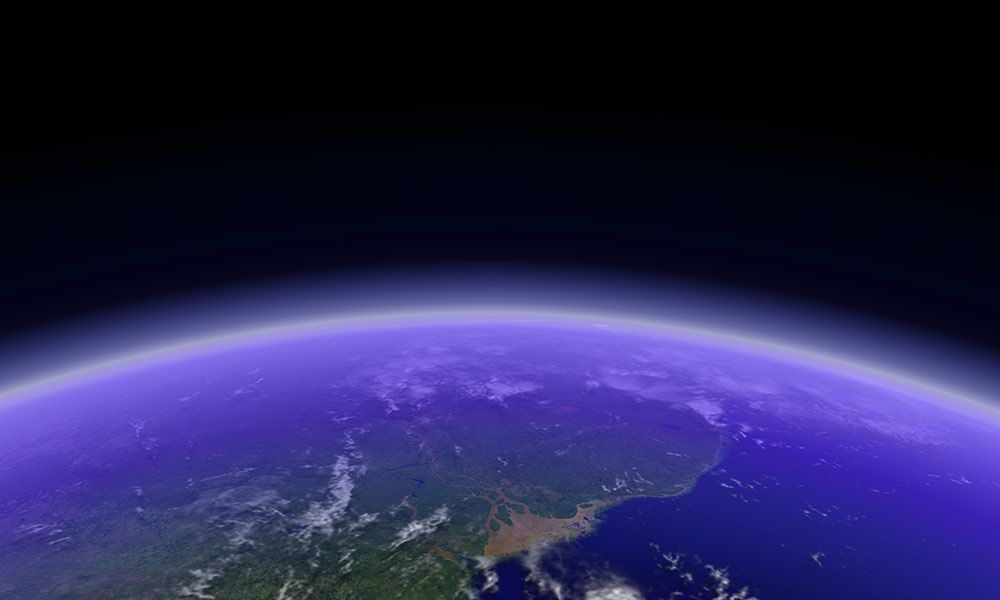
Ozone is a molecule that contains three oxygen atoms. It is produced in chemical reactions involving sunlight, where it is rapidly converted back and forth from the oxygen we breath, which has only two oxygen atoms. The majority of Earth’s ozone is in the stratosphere, more than five miles above the planet’s surface. Stratospheric ozone is sometimes called “good” ozone because it blocks most of the sun’s harmful ultraviolet radiation and is thus essential for life on Earth.
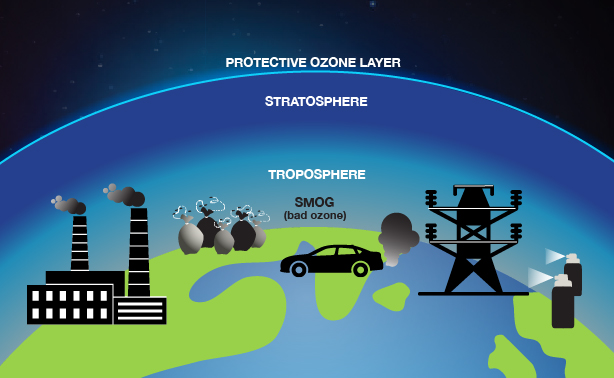
The rest of Earth’s ozone lies in the troposphere, the lower part of the atmosphere in contact with Earth’s surface. Tropospheric ozone is sometimes called “bad” ozone because its reactivity can be harmful to plants, animals, and people. For example, ozone is a primary component of urban smog, which forms near ground level in sunlight-driven reactions between oxygen and pollutants from fossil fuel combustion.
“The thing about ozone is that scientists have only been studying it in detail for a few decades,” says Laurence Yeung, an assistant professor of Earth, environmental, and planetary sciences at Rice University, and the lead author of the study. “We didn’t know why ozone was so abundant in air pollution until the 1970s. That’s when we started to recognize how air pollution was changing atmospheric chemistry. Cars were driving up ground-level ozone.”
The limits of 19th-century tropospheric ozone data
The earliest measurements of tropospheric ozone date back to the late 19th century, but researchers today recognize that this data can be unreliable. At the time, strips of paper were first soaked in a mixture of starch and potassium iodide and then exposed to air for 12 hours. The paper would turn a shade of purple relative to the amount of ozone present, and researchers would compare the color to a reference sheet on a scale of 1 to 10. The method is “crude compared to modern scientific instruments,” Murray says. “The human error introduced by interpreting colors aside, scientists now know that the method is also prone to interference from humidity as well as other pollutants.”
Further complicating matters, the century-old data conflicts with estimates from today’s state-of-the-art atmospheric chemistry models; the older data suggests that ground-level ozone could have increased up to 300 percent over the past century, compared to preindustrial times. In contrast, today’s best computer models suggest that ground-level ozone increased by a more moderate 25 to 50 percent.
The magnitude of that difference complicates the efforts of scientists to make predictions. “This has always added a level of uncertainty to the estimates of global warming due to tropospheric ozone,” says Murray.
New ice core data confirms climate models
The onset of industrialization and the widespread burning of fossil fuels around 1850 brought about the increase in tropospheric ozone. Researchers reasoned this increase should have left a recognizable trace. Collecting direct measurements of tropospheric ozone is not straightforward, however, Murray says. “Tropospheric ozone is so chemically reactive, it is not preserved in ice-core bubbles like other greenhouse gases such as methane and carbon dioxide, so we don’t have direct observational evidence of what its preindustrial abundances were.”
Instead, one can look for fingerprints that ozone imparts on other gases in the atmosphere. Isotopes are atoms that have different masses than the particular chemical element, but that can be substituted for the element in a molecular compound. Recently, technology such as that at Yeung’s lab has progressed to be able to measure two such substitutions in atmospheric oxygen.
The researchers collected ice cores and firn (compressed snow that has not yet formed ice) from Antarctica and Greenland. They extracted ice-core bubbles trapped within the ice and firn and examined isotopic measurements of atmospheric oxygen from preindustrial times to the present. Their results confirmed both the increase in tropospheric ozone and the magnitude of the increase that had been predicted by recent atmospheric computer models. They found that tropospheric ozone increased about 40 percent during the 20th century, compared to preindustrial times, which is consistent with the predictions in the models developed by Murray and his team.
“Our findings are independent observations supporting the magnitude of the global increase in tropospheric ozone predicted by models used to inform international climate and public health assessment reports,” Murray says. “This creates greater confidence in estimates of human influence on global climate change and public health, thereby informing mitigation strategies.”
Read more
Ancient ozone levels provide glimpse into future effects of climate change
Invisible molecules in the air around us act as miniscule cleanup crews to remove pollution. In order to better understand the power of these tiny cleansers, known as atmospheric oxidants, a computer model developed at Rochester shows how the concentration of oxidants changes under different climate conditions and temperatures.
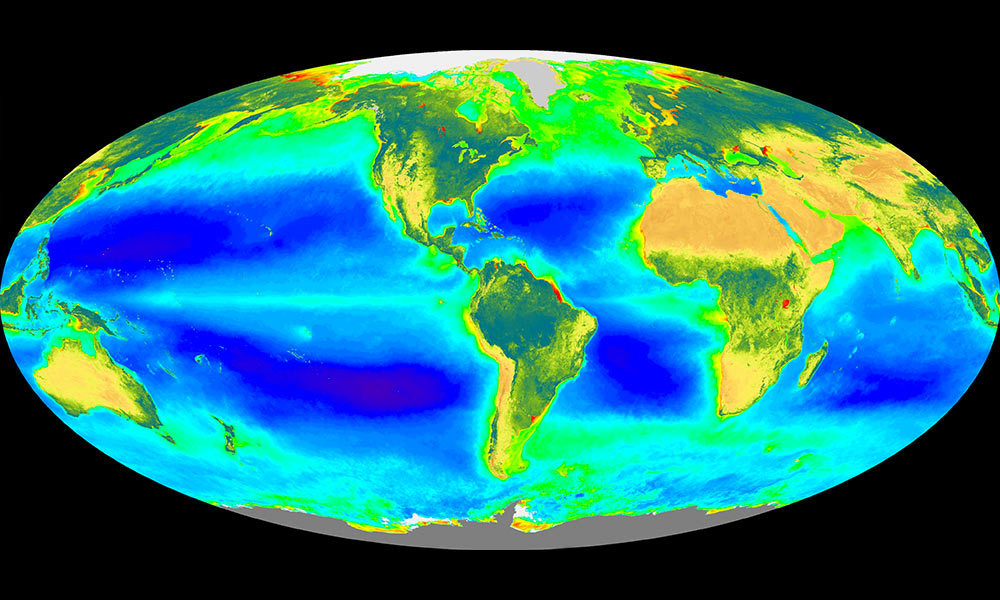
Using data science to understand global climate systems
Earth science and computer science have been closely intertwined since the development of modern computers. Rochester scientists are using computer models and satellite data to explore the global methane cycle and exchange of methane between the atmosphere and ocean and freshwater lakes.


