Features
What questions would you ask, if you could get the data? If you had access to the right data set—and could focus the right technology to examine it—could you articulate a new question that advances your field, your practice, or your business?
Sometimes described as the defining discipline of the early 21st century, data science is changing the way researchers, scholars, doctors, teachers, musicians, business people, and others think about what they do. The possibilities are transforming humanities scholars into imaging scientists (see page 26), giving music theorists the tools of genomics, and helping to reshape the clinical treatment of human beings through the power of machine-based algorithms.
It’s purposefully interdisciplinary, and welcoming to entrepreneurial perspectives. It relies on new resources, such as Rochester’s Health Science Center for Computational Innovation, and organizing initiatives such as the University’s new Wegmans Hall, home to the Goergen Institute for Data Science (see page 38).
But most important, it’s designed to address new questions—the kind that may not even have arisen without it. Here’s a sample of some of the ways data science–oriented perspectives are influencing work at Rochester.
Named in recognition of the support of the Wegman Family Charitable Foundation, the 58,000-square-foot Wegmans Hall is designed as an interdisciplinary campus hub for work involving data science.
Dedicated during Meliora Weekend last fall, the building will open for researchers this year. Danny Wegman, chair of the University’s Board of Trustees, announced the foundation’s $10 million commitment to the project in 2014.
The building is home to the Goergen Institute for Data Science, a University-wide center that helps to advance the University’s research strengths in machine learning, artificial intelligence, biostatistics, and biomedical research, and to foster research collaborations throughout the University and through industry partnerships.
The institute is named in recognition of the support of University Board Chair Emeritus Robert Goergen ’60 and his wife, Pamela, who committed $11 million to the University’s multimillion initiative in data science, a centerpiece of the University’s strategic plan.
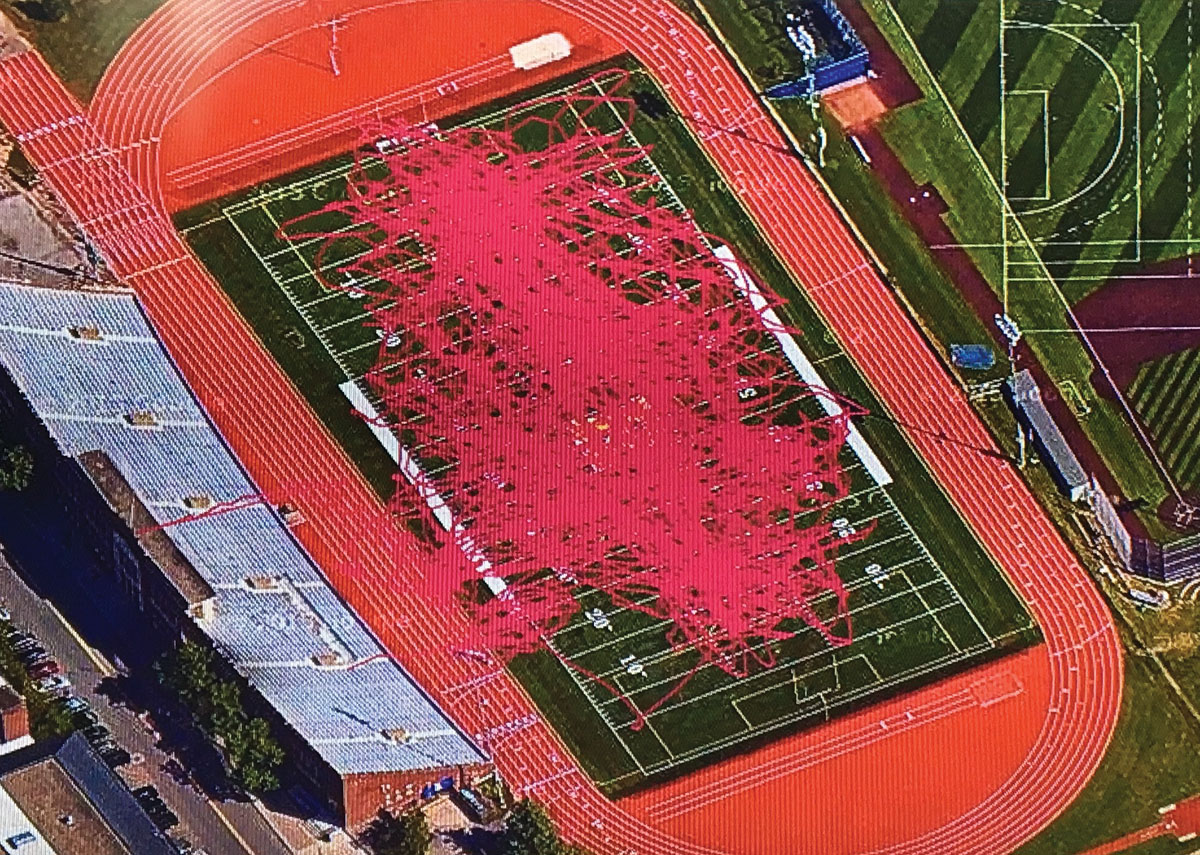 BUSY DAY: Tracked by a sensor under her uniform, women’s soccer player Kim Stagg ’17 traveled more than 10 miles and burned more than 2,000 calories during her final home game. (Photo: Athletics and Recreation)
Kim Stagg ’17 endured a rigorous workout in the women’s soccer season finale last November.
The midfielder from Winter Springs, Florida, ran 10.05 miles, burned 2,006 calories, and completed 63 sprints in a 2–2 tie with Emory University. She ran at an average speed of 3.2 miles per hour. And she left cleat marks over 90 percent of Fauver Stadium.
“She was everywhere,” Yellowjackets coach Thomas (Sike) Dardaganis says.
Dardaganis knows because he has a data visualization tool known as a heat map to prove it. His program was one of the first in the nation (and remains the only one at Rochester) to use Polar Team Pro, a GPS–based performance tracking system for team sports. Each player straps a sensor under her jersey, close to her heart. The sensor tracks movement, monitors heart rate, and acts as an accelerometer, tracking how many times an athlete runs at full speed.
The information is logged in an iPad carried by a team manager during practices and games. Once the iPad is loaded onto a docking station, the sensors start charging, and the data for each player are uploaded for review.“From an analytic standpoint, it’s fantastic,” says Dardaganis, in his sixth year as head coach after serving 14 as an assistant coach for the team.
When Rochester signed on with Polar two years ago, Polar sent a specialist to measure Fauver Stadium’s dimensions and create a GPS map tailored to that field. The rewards were immediate.
Using that information helped Dardaganis and his staff adjust the team’s workouts to better match the expectations of games and to better personalize goals for each player.
The data also helped spark important conversations.
“Athletes don’t always communicate with coaches when they’re sick or injured,” Dardaganis says. “Having the data right there? Well, that’s a great conversation starter.” —Jim Mandelaro
Ulrik Soderstrom ’16, ’17 (MS)
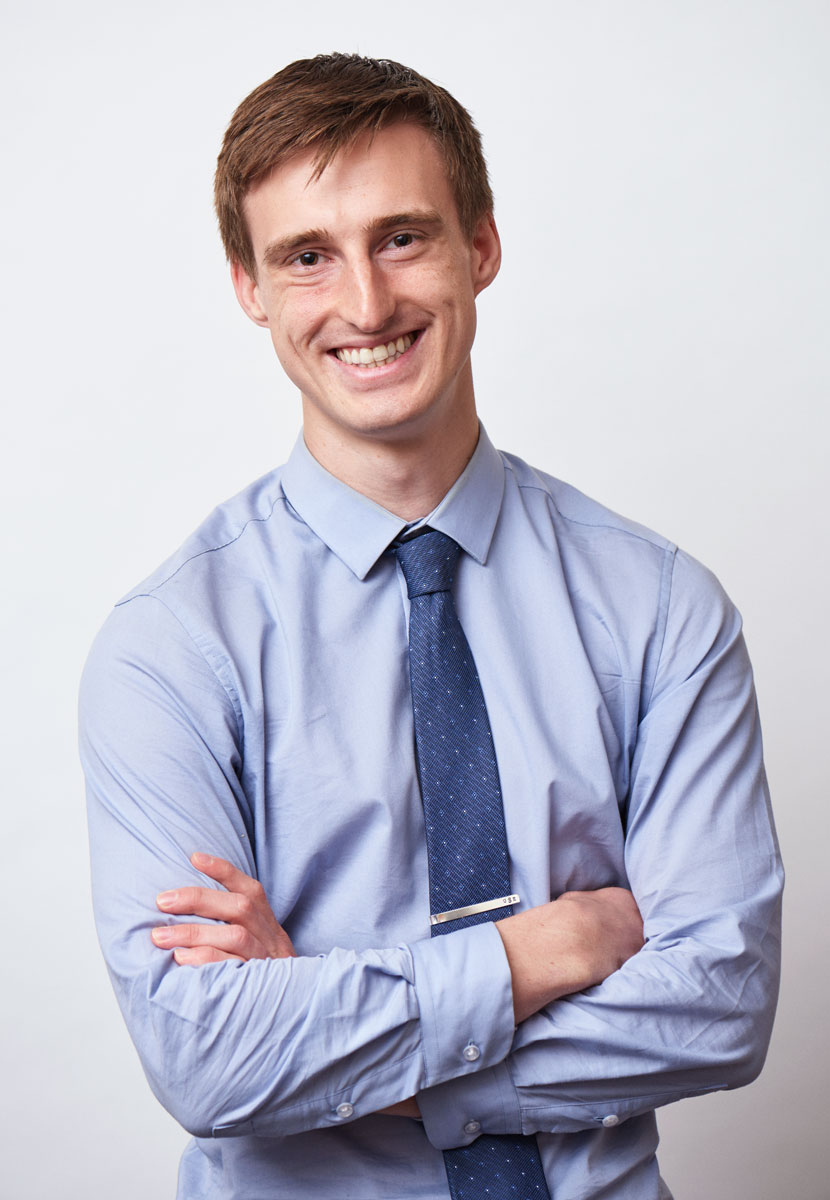 FIRST WAVE: Soderstrom was one of Rochester’s first data science majors. (Photo: Brandon Vick)
One of the first Rochester students to graduate with a BA in data science, Ulrik Soderstrom ’16, ’17 (MS) is combining his love of math and computers with a passion for environmental sustainability and renewables. He’s finishing his coursework for a master’s degree in data science, planning to graduate in May.
Along the way, he has put his education to use as a data scientist on campus, in Rochester, and other parts of the country.
NOAA
The National Oceanic and Atmospheric Administration is an agency within the United States Department of Commerce that conducts environmental research focused on the oceans and the atmosphere. As an intern, I worked in NOAA’s environmental modeling center with wave propagation data. The NOAA has tens of thousands of buoys all around the oceans. Based on the effects and trajectory of waves, they can, for instance, predict hurricanes. They also have a computer model that simulates this buoy data. I took the outputted model data, compared it with the real buoy data, and did statistical validation to figure out how close they were mathematically, and then suggested heuristics to improve those models. Because there was so much data—more than 30 years of buoy data with tens of thousands of points all around the ocean—we used supercomputers to process this information.
Arable
A data science agriculture company, Arable has a data-monitoring system called a Pulsepod that they offer to farmers to monitor their crops. Each pod has a solar panel on top and takes in different weather parameters like rainfall, relative humidity, and temperature. Using that data, Arable does localized weather forecasting of fields that is more accurate than the National Weather Service. I worked with Arable to test machine-learning algorithms to figure out which ones were the most optimal to forecast weather.
ROCSPOT
ROCSPOT is a cool company because they’re a nonprofit organization that educates people about solar incentives and also focuses on bringing solar to low-income neighborhoods. We also want to pursue projects that redistribute energy because we could power a large portion of the country on solar energy if we could transport it and if the laws allowed for that. This is a really big data science problem because of the shear amount of information. One of ROCSPOT’s goals is to have full renewable energy in Rochester by 2025. Even in cloudy Rochester, our location and angle to the sun mean we get an enormous amount of solar radiation. —As told to Lindsey Valich
To computer scientist Henry Kautz, Twitter is like a distributed sensor network. Hundreds of millions of tweets are posted to the platform each day, with each user observing and reporting on some aspect of the world.
“Each report is very noisy,” says the Robin and Tim Wentworth Director of the Goergen Institute for Data Science. “But the aggregate results can be reliable.”
What does the aggregate show?
Tracking sickness and disease
The Las Vegas Health Department tested an app developed by Kautz and his team that connected food-poisoning-related tweets to the restaurants that prompted them. The researchers found that the tweet-based system led to citations for health violations in 15 percent of inspections, compared to 9 percent using the traditional random system. That resulted in an estimated 9,000 fewer food poisoning incidents and 557 fewer hospitalizations during the course of the study.
Increasing transparency
Huaxia Rui, an assistant professor at the Simon Business School, uses Twitter to study the relationships between companies and their customers. Working with Simon professor Abraham Seidmann and PhD student Priyanga Gunarathne, Rui analyzed more than 450,000 Twitter messages and found that airlines were more likely to respond to tweets sent by customers with a higher number of followers. The study raises interesting questions about fairness as well as how companies handle requests for engagement.
Taking the pulse of voters
Jiebo Luo, associate professor of computer science, PhD student Yu Wang, and their colleagues tracked the Twitter followers of Donald Trump, Hillary Clinton, Bernie Sanders, and other candidates to better understand the dynamics of the 2016 campaign. Their exhaustive, 14-month study of each candidate’s Twitter followers offered clues as to why the race turned out the way it did.—Bob Marcotte
‘There is a lot you can quantify about music.’
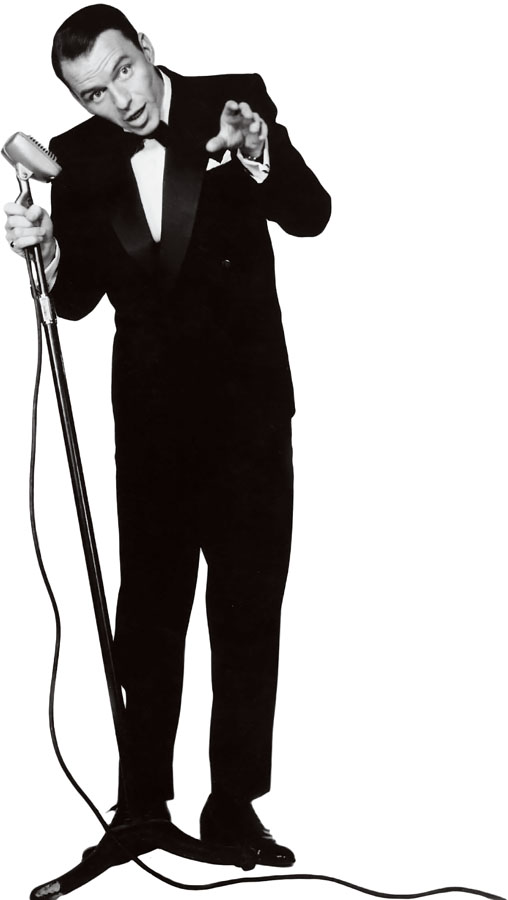 FRANKLY: Mimicking a common human ability to pick out the sound and style of individual musicians (like Frank Sinatra),
a Rochester team is working on software than can pick out tell-tale musical motifs. (Photo: AF Archive/Alamy)
FRANKLY: Mimicking a common human ability to pick out the sound and style of individual musicians (like Frank Sinatra),
a Rochester team is working on software than can pick out tell-tale musical motifs. (Photo: AF Archive/Alamy)There’s much that’s mysterious about music.
“We don’t really have a good understanding of why people like music at all,” says David Temperley, a professor of music theory at the Eastman School of Music. “It doesn’t serve any obvious evolutionary purpose, and we don’t understand why people like one song more than another or why some people like one song and other people don’t. I don’t think we’re anywhere near uncovering all of the mysteries of music, but there are a lot of questions that people are starting to answer with data science.”
Temperley and other researchers at the University are exploring the intersection of data science and music. As Temperley says, “there is a lot you can quantify about music.”
Mimicking human music recognition
Mark Bocko, Distinguished Professor and chair of the Department of Electrical and Computer Engineering, combines his love of music and science to study subjects ranging from audio and acoustics to musical sound representation and data analytics applied to music.
One of his group’s projects involves using computers to analyze digitally recorded music files, with the goal of better understanding and mimicking the ways in which humans are able to recognize specific singers and musical performance styles. Using data analysis tools from genomic signal processing, similar to that used to study sequences in DNA, Bocko and his team search musical data for recurrent patterns—common sequences known as motifs—in the subtle inflections of performers and performance styles.
The system would be able to illustrate, for example, that Michael Bublé has a singing style similar to Frank Sinatra’s, but less similar to Nat King Cole’s. The approach may ultimately enable computers to learn to recognize the subtle nuances between singers and musical performances that human beings pick up on quickly simply by listening to the music.
Transcribing music
Zhiyao Duan, an assistant professor of electrical and computer engineering, has been working with Temperley to extract data from songs to produce automatic music transcriptions—feeding audio into a computer to generate a score.
Duan uses signal processing and machine learning to help the computer identify the pitch and duration of each note and to output musical notation.
Rocking songs through Wikipedia
Darren Mueller, an assistant professor of musicology, is creating a corpus of information based on a large-scale data analyses of Wikipedia’s coverage of musical performers and genres. By applying computer algorithms and machine learning to sort through entries on music, he hopes to analyze information about musical history and how that information is distributed.
“Usually musicians are a little skeptical when anyone is like, ‘Oh, I want to quantify music,’ because they put their hearts and souls into music,” Mueller says. “It’s their art and there’s always this sort of tension between the arts and science, but there’s no reason these two things can’t work together.”
A project aims to give physicians better information about how to treat your condition.
When her medications aren’t working, Bernadette Mroz says, “my world goes into a spin cycle. I cannot function mentally, emotionally, or physically.”
Mroz, who has Parkinson’s disease, doesn’t expect a cure in her lifetime. But she’s hopeful that Rochester researchers will soon be able to “better tune in” the medications that help control her tremors and memory lapses. Toward that end, the Hannibal, New York, resident has participated in a Rochester clinical trial in which she wore five sensors—one on each of her limbs and her chest. Thirty times a second, each sensor recorded acceleration in three directions—in effect recording her every movement, including tremors, for 46 hours at a time. The sensors, made by a biomedical health care analytics company called MC10, provide a wealth of data that allows physicians to make better-informed decisions about the progression of her disease—even about adjusting her medications.
“Instead of treating all patients as averages, which none of us are, we will be able to customize treatment based on individual data,” says Gaurav Sharma, a professor of electrical and computer engineering who’s collaborating with University neurologist Ray Dorsey to use the sensors and data science to improve the treatment of patients with Parkinson’s or Huntington’s disease.
Supported by MC10, whose CEO is Scott Pomerantz ’81, ’83S (MBA), the project is one of many at Rochester using data science to advance clinical care.
Using machine learning, in which computers develop the ability to learn without being explicitly programmed, the team is developing ways to analyze some 25 million measurements generated by the sensors for each patient over a two-day period. They also are working on the challenge of translating all that information in ways that are helpful to physicians and other health care professionals.
“If you tell a physician you have to look at two gigabytes of data to figure out what’s going on with your patient, you don’t have a chance,” Sharma says. “But if you can present the data in easily digestible plots and visualizations, the physician can comprehend it and act on it.”
The goal of the research is to change how patients and physicians help each other understand disease and treatment.
Under a scenario envisioned by Sharma, Dorsey, and others, a few days before an appointment, patients would drop by a neighborhood pharmacy, pick up a pack of adhesive patches embedded with electronic sensors, and place them on their skin, providing more accurate and comprehensive measurements than are possible in a doctor’s office.
For now, research participants mail their patches back to the researchers. Soon, Sharma and Dorsey say, the sensors will be as unobtrusive as temporary tattoos, transmitting data wirelessly to a patient’s smart phone, then on to a secure database for analysis. Patients in even the remotest areas could be monitored from their homes.
“This will transform the way we care for patients with Parkinson’s and Huntington’s disease,” says Dorsey, the David M. Levy Professor in Neurology.
Mroz, who was first diagnosed with Parkinson’s disease in 2004, continues to volunteer as a board member at a local humane society and enthusiastically participates in clinical trials at the University.
It’s part of her obligation as a Parkinson’s patient to be an ambassador and advocate, she says.
“I will not let this defeat me.”
For researchers who know how to extrapolate it, there’s a lot of data to be found in K-12 schools. It’s information that can provide an important lens for exploring questions involving student success, how resources are allocated across districts, and other administrative, curricular, and financial issues. The Warner School of Education’s Karen DeAngelis, an associate professor and chair of educational leadership, and Kara Finnigan, an associate professor and director of the educational policy program, bring a data science–informed approach to such research.
“I would say access to data has become easier,” says DeAngelis, who’s also associate dean for academic programs. In her research, she analyzes data on how much schools spend on security measures. While at a conference, she discovered that schools in Texas are required to report that information to the state. “Suddenly we had district-level data for the state of Texas, and we didn’t have to go out and collect it. We went to Texas and were able to get information about all of the spending categories for all the 1,000-plus districts in Texas and do an analysis on what proportion of district budgets they allocate to security and safety.”
The possibilities for asking such questions and for using such analyses to make policy recommendations, she says, are becoming more common as educational researchers and their students hone their abilities with data science.
What types of data do you collect?
DeAngelis: My academic background and professional experience is in economics and finance, so I bring those sorts of disciplinary lenses to my work. My research questions involve the allocation of resources with specific interests in teacher and administrator labor market policies. To do that work, I typically rely on large-scale administrative data sets.
Finnigan: My work is focused on how education policies are being implemented in the field. I’m usually collecting survey data or interviewing participants in the schools or districts—but I also rely on some existing data, too. It depends on the question I’m asking and what data are available.
How does the ability to process large data sets help you understand what you’re studying?
DeAngelis: I think there’s a richness of data now that enable us to better understand context. It’s really about access to larger amounts of data than we had in the past. I’d say there’s been progress in statistical analyses, which has definitely influenced my work.
What’s next for data science in education research?
DeAngelis: I’m excited about the advances in big data that other disciplines are making—and thinking about what methodological approaches I might bring to education work. Perhaps advances in the health sciences or other fields might be applicable to helping me better answer some of the questions I’m asking.
Finnigan: I think we have to be more attentive to the ways we train students. When you have big data, you can get very lost or you could start asking the wrong questions. It’s important to make sure students are intentionally trained to understand the multitude of data that’s out there without being overwhelmed.
Nick Bruno ’17 is the lead editor of the Quadcast, a University podcast, from which this interview was adapted. You can hear the full podcast at Soundcloud.com/urochester.
Rochester Review
March–April 2017
Vol. 79, No. 4
Story as a PDF