
Page 17 - 2019-2020 Endowment Report | University of Rochester
P. 17
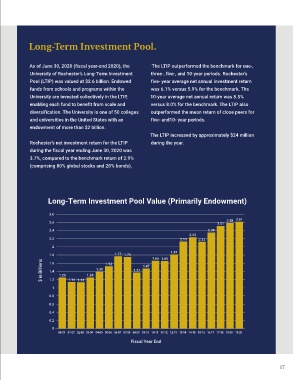
Long-Term Investment Pool.


             As of June 30, 2020 (fiscal year-end 2020), the     The LTIP outperformed the benchmark for one-,
              University of Rochester’s Long-Term Investment    three-, five-, and 10-year periods. Rochester’s
              Pool (LTIP) was valued at $2.6 billion. Endowed   five- year average net annual investment return
              funds from schools and programs within the        was 6.1% versus 5.9% for the benchmark. The
              University are invested collectively in the LTIP,   10-year average net annual return was 8.5%
             enabling each fund to benefit from scale and       versus 8.0% for the benchmark. The LTIP also
              diversification. The University is one of 50 colleges   outperformed the mean return of close peers for
              and universities in the United States with an     five- and10- year periods.
             endowment of more than $2 billion.
                                                                The LTIP increased by approximately $24 million
              Rochester’s net investment return for the LTIP    during the year.
              during the fiscal year ending June 30, 2020 was
             3.7%, compared to the benchmark return of 2.9%
             (comprising 80% global stocks and 20% bonds).


                     Long-Term Investment Pool Value (Primarily Endowment)


                      3.0
                                                                                                2.58  2.61
                      2.6                                                                   2.51
                      2.4                                                               2.35
                                                                                2.23
                      2.2                                                   2.13    2.12
                       2
                                                                        1.81
                      1.8                        1.77 1.75
                                                                 1.66 1.65
                  $ in Billions  1.4  1.25  1.26  1.39   1.37  1.47
                      1.6
                                             1.52
                      1.2
                       1      1.14 1.13
                      0.8

                      0.6
                      0.4
                      0.2
                       0
                         00-01 01-02 02-03 03-04 04-05 05-06 06-07 07-08 08-09 09-10 10-11 11-12 12-13 13-14 14-15 15-16 16-17 17-18 18-19 19-20
                                                        Fiscal Year End


                                                                                                                      17