Page 18 - 2019-2020 Endowment Report | University of Rochester
P. 18

Asset allocation and return.


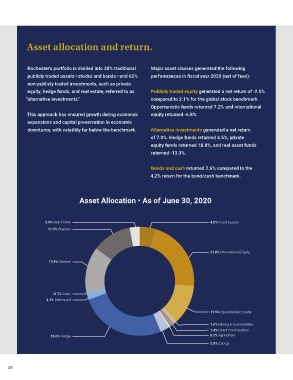
             Rochester’s portfolio is divided into 38% traditional   Major asset classes generated the following
             publicly traded assets—stocks and bonds—and 62%    performances in fiscal year 2020 (net of fees):
             non-publicly traded investments, such as private
            equity, hedge funds, and real estate, referred to as   Publicly traded equity generated a net return of -2.5%
            “alternative investments.”                          compared to 2.1% for the global stock benchmark.
                                                                Opportunistic funds returned 7.2% and international
            This approach has ensured growth during economic    equity returned -6.8%.
            expansions and capital preservation in economic
             downturns, with volatility far below the benchmark.  Alternative investments generated a net return
                                                                of 7.0%. Hedge funds returned 4.5%, private
                                                                equity funds returned 18.8%, and real asset funds
                                                                returned -13.3%.

                                                                Bonds and cash returned 2.6% compared to the
                                                                4.2% return for the bond/cash benchmark.


                                  Asset Allocation • As of June 30, 2020


                    3.0% Real Estate                                                     4.8% Fixed Income
                     11.8% Buyouts


                                                                                         21.8% International Equity

                     13.8% Venture


                       -0.7% Cash
                    2.1% Distressed

                                                                                         11.9% Opportunistic Equity

                                                                                         1.0% Mining & Commodities
                                                                                         1.4% Direct Commodities
                      26.0% Hedge                                                        0.3% Agriculture
                                                                                         2.8% Energy


    18
   13   14   15   16   17   18   19   20   21   22   23